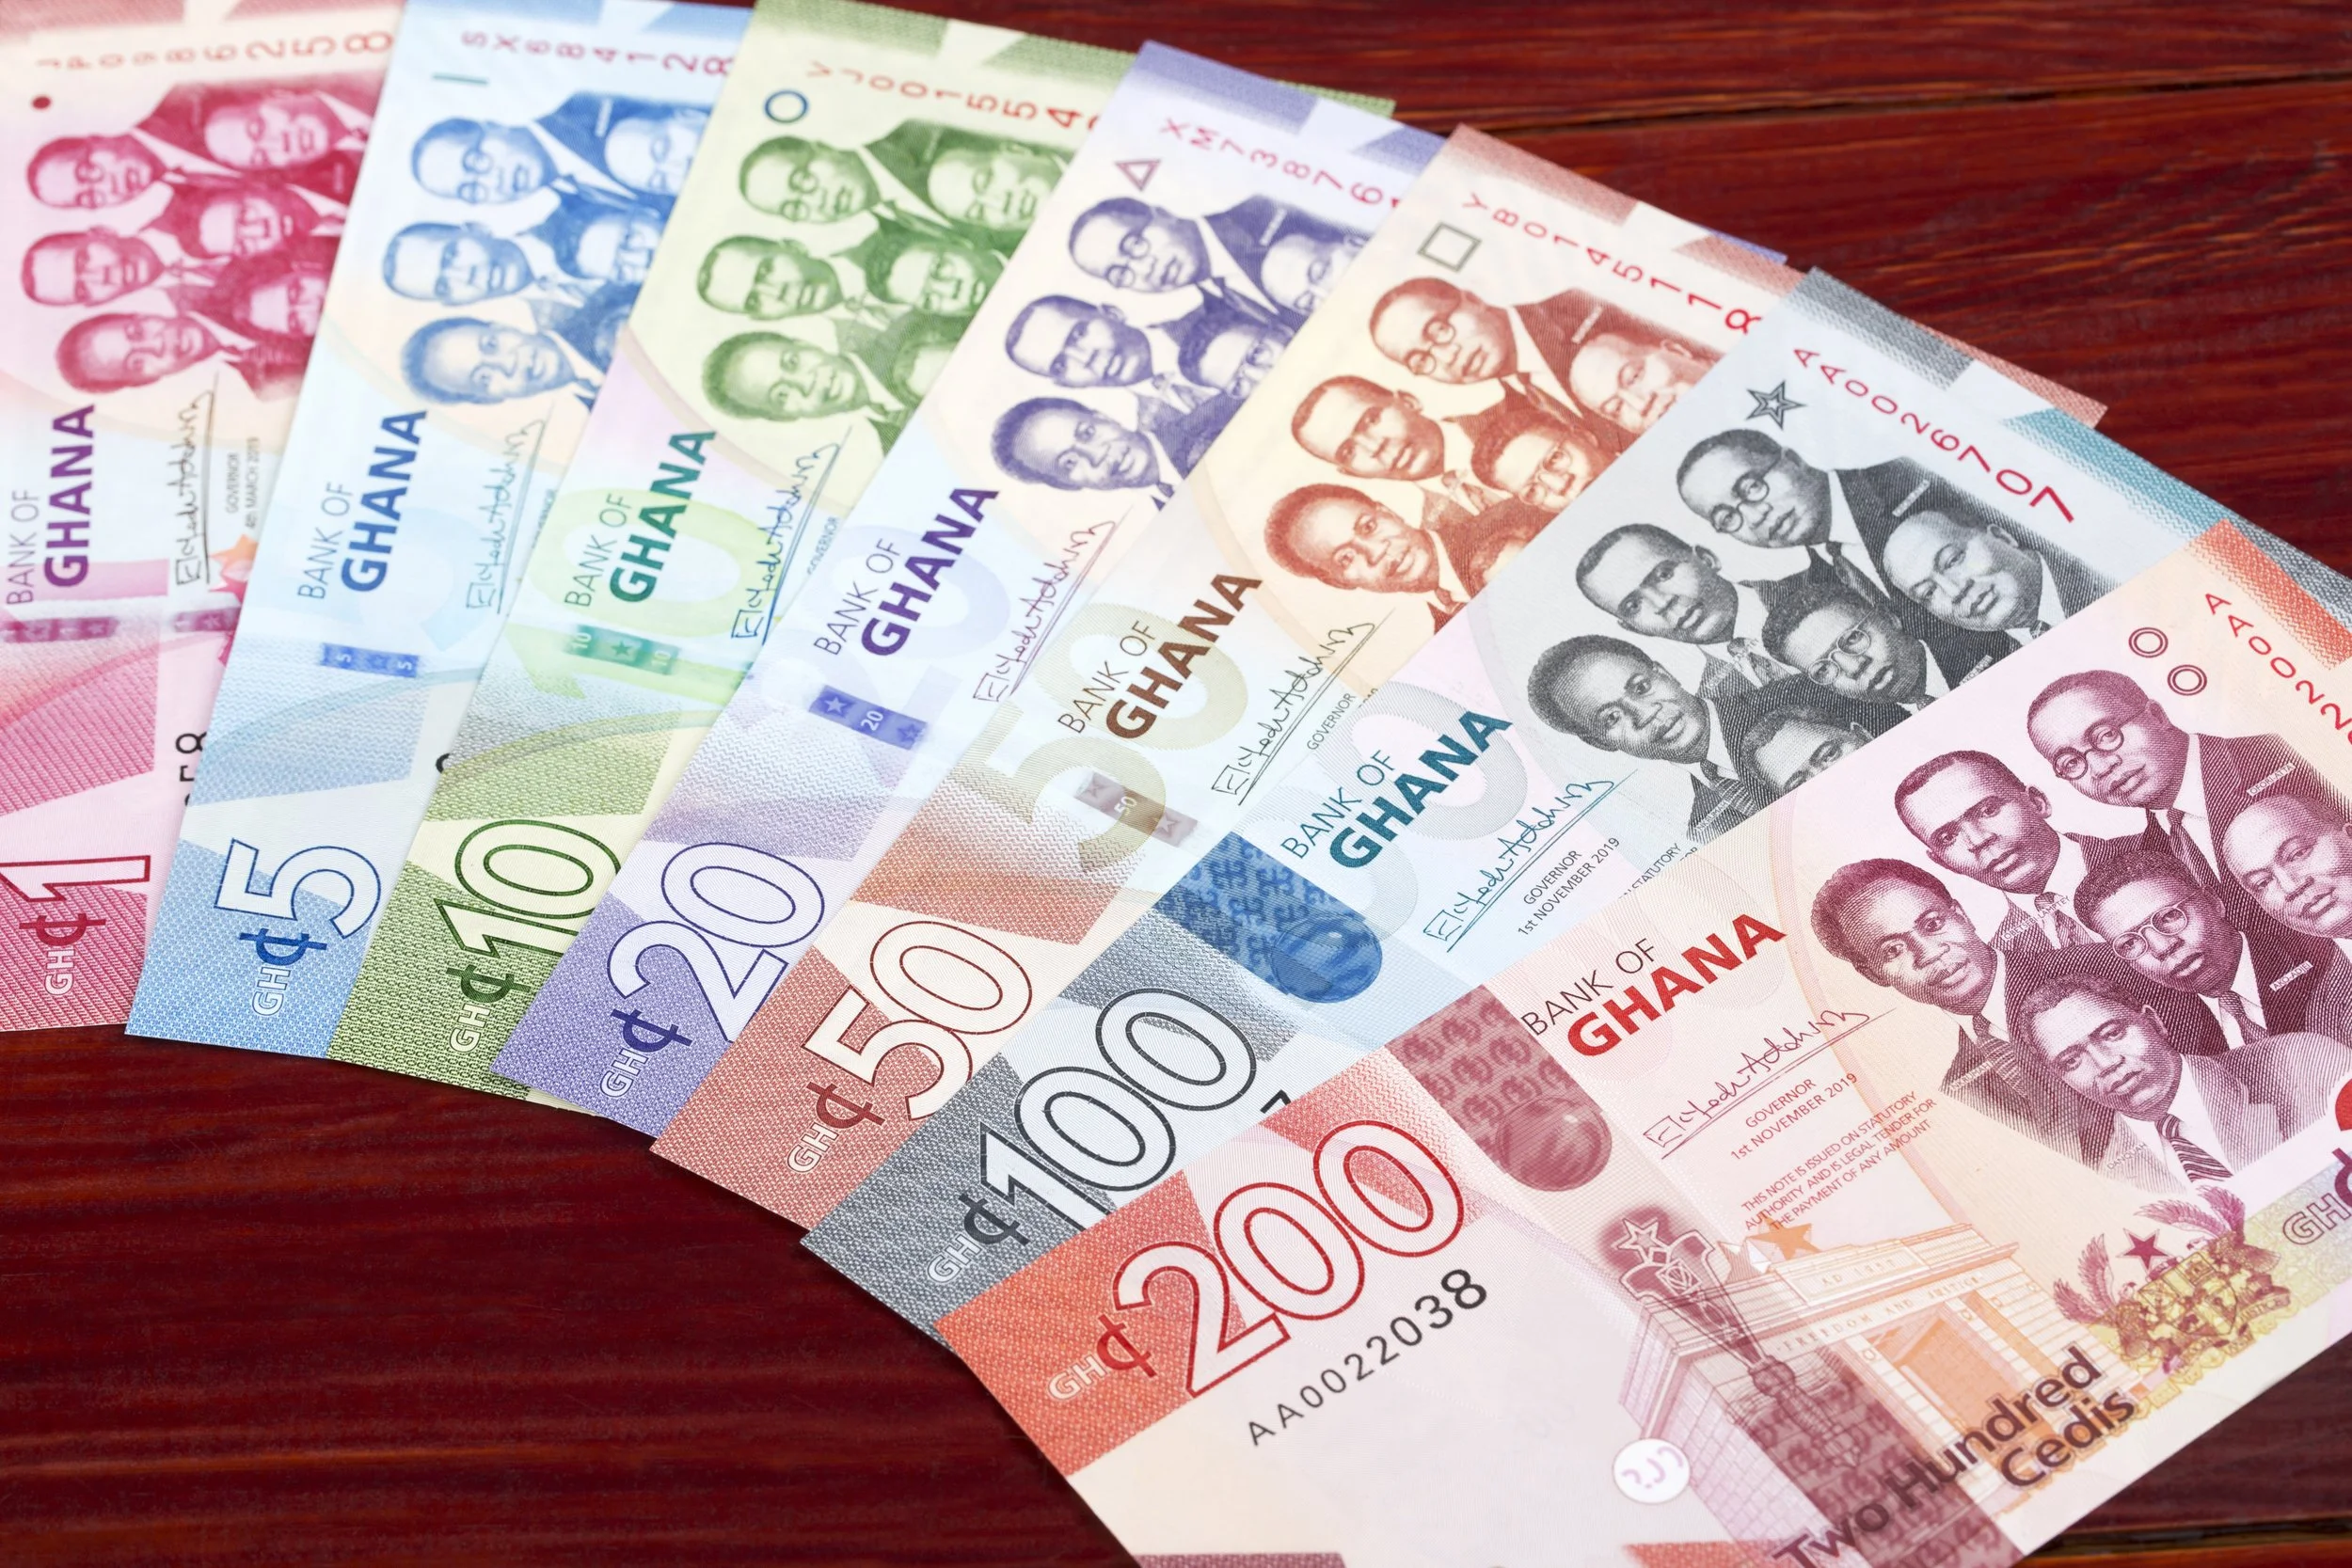
Analysis of USD/GHS Exchange Rate Trend – April 2025
The USD to GHS exchange rate saw a notable appreciation of the Ghanaian Cedi over the month of April 2025. The rate dropped from 15.53 on April 2 to 14.15 by April 30, reflecting a strengthening of the local currency by nearly 9% in just under a month.
Trend Summary:
● Early April (2–17 April):
Rates were relatively stable, hovering around 15.52–15.53, indicating a flat trend.
● Mid to Late April (18–25 April):
A gradual decline began from 15.46 on April 17 to 14.55 by April 25, showing a shift toward Cedi appreciation.
● Final Week of April (25–30 April):
A steep appreciation occurred — from 14.55 on April 25 to 14.15 on April 30 — suggesting a surge in demand for the Cedi or policy-driven support.
Possible Causes of Cedi Appreciation:
Bank of Ghana Intervention:
o The central bank may have injected forex into the market or raised interest rates, making the Cedi more attractive.
Improved Export Receipts:
o Increased revenue from gold, cocoa, or oil exports may have bolstered forex reserves.
External Inflows:
o Possible disbursement of international loans, donor support, or remittances could have boosted USD supply.
Reduced Import Demand:
o A slowdown in import activity or stricter FX controls may have reduced pressure on the local currency.
Speculation and Market Sentiment:
o Traders and investors anticipating policy changes or economic stability could have driven short-term demand for the Cedi.
Conclusion:
April 2025 was marked by a notable appreciation of the Ghanaian Cedi against the US Dollar. After being relatively stable for the first half of the month, the GHS gained value significantly in the second half. This is a positive signal for inflation control and import costs but could raise concerns for exporters and remittance recipients.
General Trend Analysis of Brent Crude Prices in April 2025
Brent crude oil prices declined overall throughout April 2025, starting at $73.78 on April 1st and ending at $61.06 on April 30th. This represents a monthly drop of $12.72, or approximately 17.24%, indicating bearish market sentiment during the period.
Key Highlights:
● Opening Price (April 1): $73.78
● Closing Price (April 30): $61.06
● Highest Price: $73.78 (April 1)
● Lowest Price: $61.06 (April 30)
Phases of Movement:
1. Sharp Early Decline (April 1–4):
● The price fell steeply from $73.78 to $65.58.
● This early drop of over $8 could be due to profit-taking, macroeconomic concerns, or reduced demand.
2. Short-Term Stabilization (April 7–11):
● Prices hovered around $63–65 with mild fluctuations.
● Signs of market attempting to find a short-term floor.
3. Mid-Month Rebound (April 14–18):
● Prices climbed steadily from $64.88 to $67.96, suggesting a temporary bullish sentiment.
● Possibly driven by supply constraints, geopolitical developments, or inventory draws.
4. Gradual Decline (April 21–30):
● After peaking mid-month, prices trended downward again, ending at the month's low of $61.06.
● Reflects persistent downward pressure from global market fundamentals such as oversupply or weak demand outlook.
Statistical Summary:
● Average Price (April 2025): Approximately $65.30
● Total Trading Days: 22
● Days with Price Increases: ~7
● Days with Price Declines: ~15
Interpretation:
The sharp decline in April suggests a market under pressure. Potential drivers might include:
● Macroeconomic slowdowns (e.g., weak manufacturing data from major economies)
● Increased oil supply (e.g., higher OPEC+ output or U.S. shale production)
● Reduced geopolitical tension (e.g., easing of conflicts that previously supported prices)
● Strengthening of the U.S. dollar (making oil more expensive for holders of other currencies)
Prices At Selected Local Pumps As At Monday, May 5, 2025
1. Star Oil Co. •Petrol - Ghc 12.99/LTR. •Diesel - Ghc 13.99/LTR
2. Allied •Petrol - Ghc 12.99/LTR. •Diesel - Ghc 14.50/LTR
3. ZEN •Petrol - Ghc 13.69/LTR. •Diesel - Ghc 14.74/LTR
4. JP •Petrol - Ghc 13.57/LTR. •Diesel - Ghc 14.57/LTR
5. Radiance •Petrol - Ghc 12.77/LTR. •Diesel - Ghc 13.97/LTR
6. PUMA •Petrol - Ghc 13.90/LTR. •Diesel - Ghc 14.75/LTR
7. GOIL •Petrol - Ghc 13.69/LTR. •Diesel - Ghc 14.41/LTR
8. PETROSOL •Petrol - Ghc 14.35/LTR. •Diesel - Ghc 15.15/LTR
9. Shell •Petrol - Ghc 13.79/LTR. •Diesel - Ghc 14.89/LTR
10. Total •Petrol - Ghc 13.75/LTR. •Diesel - Ghc 14.75/LTR


